Since the 1980s North Carolina has not seen a decade when it wasn’t fighting challenges to district maps drawn by state legislators.
Maps outlining congressional and legislative districts are usually drawn every 10 years, after each census, and are supposed to stay in place until the next census.
This summer, litigation continues in front of the U.S. Supreme Court and North Carolina Superior Court over maps that were drawn in response to the 2010 census. Regardless of the outcome of those court cases, there is another census next year, which means the state will once again have to redraw political districts to reflect how the population has changed.
So, there is a big push right now in North Carolina – and nationwide – to reform the system, not just the maps themselves, but the way legislators draw the maps. And those reform efforts are a direct result of how the state got into the rats nest of litigation that we see today.

“This is really an issue that has salience to people now in a way that it didn't before,” said Michael Li, senior counsel with the Brennan Center for Justice in New York City, where he works on redistricting and election law. “The words redistricting and gerrymandering didn't move voters one way or the other. Now, that's completely different.”
People in North Carolina really started paying attention to the issue after the 2012 election. In North Carolina, 51% of all voters chose a Democrat to represent them in the U.S. House. That election, with those same votes resulted in four Democrats and nine Republicans going to Washington to represent the state.
A similar thing happened in 2016 with different maps; with 47% voting Democrat in the congressional election, 10 Republicans and three Democrats were elected. Democrats were up in arms.
“The reason that you see so many legal fights around redistricting is an oddity in the way that we draw districts in the United States, which is that we, in most instances, we leave it to the hands of political actors. And that is just an invitation that is too hard to resist: to gerrymander, to rig the maps in favor of your party,” said Li.
The maps used in 2012 and 2016 elections were drawn by Republicans. But Democrats have had their shot at drawing districts over the years as well, with equal controversy.
“I think among the American people as a whole, there is a deep sense that something is wrong with our democracy on many levels. But one of the big places where there's something wrong is in how we draw district lines, and they are ready for change,” said Li.
Jonathan Mattingly, a mathematics professor at Duke University, heard all the outrage from the Democrats saying the 2012 and 2016 elections were unusual.
“But I asked ‘well, is it normal?’” recalled Mattingly.
In order to figure out what would be unusual, he started a project to uncover what the baseline should be.
Mattingly and a student programmed a computer to generate maps that adhered to certain criteria: the districts should be pretty compact – no districts that look like those long, craggly preschool drawings. As much as possible, counties and cities should be kept together in the same districts, the districts should have equal number of people in each. And in order to comply with the Voting Rights Act, there should be at least two districts with a significant block of black voters.
Mattingly explains his maps as, "what would happen if no one had had their fingers on the scale tilting it one way or the other.”
The computer generated more than 20 thousand maps, each with a rating of how well it matched those criteria. And that collection of maps told a few stories.
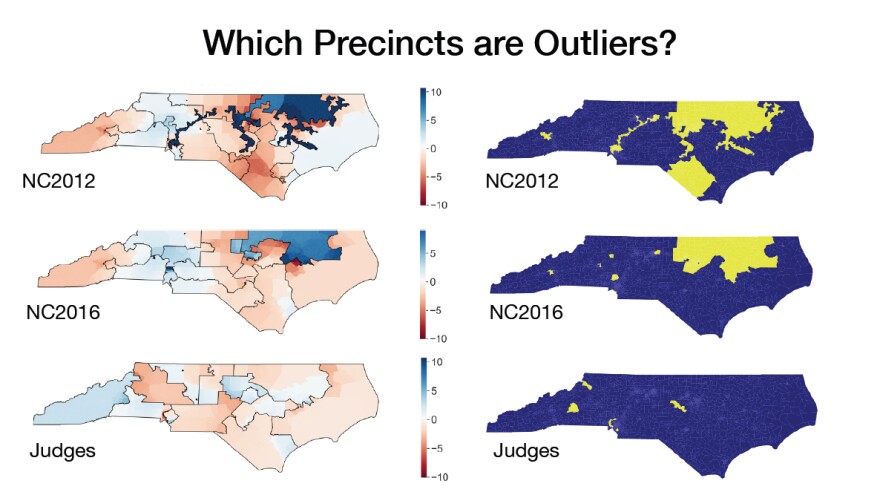
First, the maps drawn by the Republicans in both the 2012 and 2016 elections were statistical outliers. If those generally accepted criteria really were the ones considered, the maps were outside the normal range of possibility. That suggests that there were other factors at play, like politics.
Another thing the maps showed was that our eyes can deceive us.

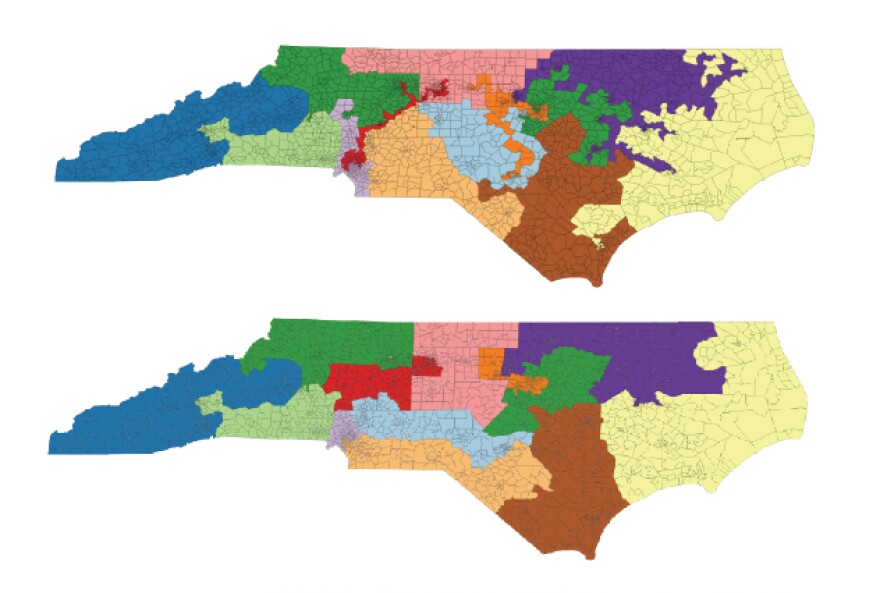
Mattingly highlights to two different maps of North Carolina. In each, the state is divided into different colored sections which represent different districts for the U.S. House.
In one map, there are districts with long and craggy boundaries. These look like they’re gerrymandered in their odd shape. In the other, the districts are much more geometric and more compact looking.
The wonky looking map is the congressional map used in 2012 the other used in 2016.
“But politically they're identical. So one is no less of a gerrymander than the other. And so I think that obsessing on how they look, the geometry in that sense, is misguided. It misses the point,” said Mattingly.
The group also developed this notion of the signature of gerrymandering. Essentially, you can see on a graph when voters have been packed into single-party districts or cracked across multiple districts to reduce the overall voting power of that group of voters.
He also evaluated a map generated by a group of retired judges through the Beyond Gerrymandering Project. Their map was not a statistical outlier and showed that despite the political geography of the state, maps conforming to statistical norms are possible.

His maps and analysis are one of the more robust ways we have to evaluate whether a map has been gerrymandered, but it can't suggest how to draw better and less controversial maps.
“I think that that's an inherently political process. I would never want to subordinate that to a computer,” says Mattingly. “[But], this can give a benchmark. It can say here's what would happen if you only use these few things you said you were thinking about mainly using and then if your map is really different, produces really different outcomes, then the onus should be put back on you."
Mattingly’s research also highlights another important point, there must be consensus on what the criteria are for drawing the maps.
And right now, that does not exist.
North Carolina Representative David Lewis (R-Harnett County) is Senior Chair of the House Redistricting Committee. He helped draw the maps that led to the 9-4 and then 10-3 Republican lead in the 2012 and 2016 house races, respectively.
From Lewis’ perspective, using political affiliation as one of the criteria is perfectly fine and legal.
“I try to tell my voters back home when I face them that I'm going to be honest with them that I am going to apply the law. I'm going to apply the traditional redistricting criteria,” said Lewis, “but in the end, a line has to go here or here and I will apply a partisan lens if it helps my party to draw it here.”
And that’s a question the U.S. Supreme Court is weighing right now: can politics be used to guide the drawing of political districts?
Phyllis Demko, a retired attorney, is a board member of the League of Women Voters of Wake County which, along with Common Cause, brought the case Rucho versus Common Cause against the Republican map drawers.
“A citizen should not be penalized for voting history, their association with the political party, or their expression of political views. That’s just basic democracy,” she said.
During oral arguments in the case earlier this year, Justice Brett Kavanaugh surprised some, including Demko, when he said “extreme partisan gerrymandering is a real problem for our democracy … I’m not going to dispute that.”
Whether the justices agree on that fact and whether they will agree that it is something they should and can weigh in on will likely be revealed some time this month.
However, the justices won’t rule on other big decisions about how the legislature draws the maps.
Like who should draw the maps – legislators or an independent commission, what other rules should guide the drawing process, and what kind of transparency should be baked into that process.
Right now, there are a couple of bills that have hung on in the General Assembly that would address some of these outstanding concerns before the next round of map drawing.
One of the more viable ones is a constitutional amendment called the FAIR Act, which has been put forth by the nonpartisan North Carolinians for Redistricting Reform.
“This is a good government initiative,” said Mary Wills Bode, the organization’s executive director. “This is making government work better for the people and also for our elected officials. When they know what the rules of the game are they can do their job better and they don't have to worry about if they're doing it right or wrong.”
The organization is trying to get the General Assembly to support a constitutional amendment that would limit the kinds of data that could be used in the redistricting process.
Political affiliation data, previous election results, and addresses of political incumbents would not be allowed for making any decisions. The bill requires transparency around the process, which has historically not existed.
“[For] our constitutional amendment ... all data and methodology used in the legislative drafting must be disclosed. People need to know what kind of data and algorithms ... are being used.”
This is part of what Jonathan Mattingly’s research highlighted. Maps may be different from the statistical models as long as people understand what the decision process was for that deviation and there is an explanation that most people support.
This constitutional amendment would require that the explanation not be any of those excluded buckets of data.
Democrats Robert Reives and Verla Insko, Republican Chuck McGrady, and conservative think tank co-founder Art Pope all support the bill.
“This isn't a Republican or Democratic issue, this is a North Carolina issue,” said Bode. “[But] we are spending a lot of time and money and resources litigating these issues.”
One thing this bill does not include which has been a trend in redistricting reform, is any requirement for an independent commission to draw the districts. That is a political non-starter for many Republicans in the state. And for anything to move forward, both parties need to be on board.
There are 65 cosponsors of this bill in the House – both Democrat and Republican – and it needs 72 to pass that chamber. Movement on the bill will likely start after the Supreme Court Ruling.
The hurdle will be the Senate. But, Bode is still hopeful that with the General Assembly’s veil of ignorance as to the outcome of the next election, and therefore questions of who will be in power to draw the new districts in 2021, it will help get people behind the constitutional amendment.
“This is an opportunity for [the legislature] to have an insurance policy … to go into 2020 knowing that regardless of who wins, there will be fair rules in the process that everyone has to play by.”
If the amendment passes the General Assembly, it would then need approval by North Carolinians in a statewide election.


